Your December was the best month your channel has ever had. Then January arrives, your views hold steady, and the revenue number in YouTube Studio is close to half what it was. Nothing in your analytics explains it. Did you get demonetized? Did the algorithm turn on you?
Neither. If you’re asking why YouTube earnings drop in January, the answer is the advertising calendar, not your channel.
The short answer: advertisers bid heavily in the run-up to the holidays and then start the new year with fresh, smaller budgets. The same 1,000 views are simply worth less to advertisers in January than in December. On our calculator’s seasonal model, January pays about 44% less than December for identical views (a 0.75× multiplier against December’s 1.35×). It is a price change in the ad auction, not a penalty on you.
What actually happens to YouTube pay in January
Ads on your videos are sold in an auction. Advertisers set budgets and bid against each other for the chance to reach your viewers. You get paid from whatever those winning bids produce — 55% of the net ad revenue on long-form videos, and 45% of what’s allocated to you from the Shorts pool.
Two things happen around the turn of the year:
- Holiday bidding ends. Retailers, electronics brands, toy companies and anyone with something to sell before December 25 spend hard in Q4. YouTube’s own analytics help page notes that “many advertisers bid higher just before holidays” (YouTube Help). When that pressure disappears, bids fall.
- New budgets start slowly. Annual marketing budgets reset in January. Plans need approving, campaigns need building, and spending ramps up over the following weeks rather than on January 1.
Notice what doesn’t change: your views, your audience and your content. What changes is the price paid for the ad shown against each view. That’s why your RPM (what you earn per 1,000 views) drops even when your traffic is flat. If RPM and CPM still blur together for you, start with YouTube RPM explained.
How big is the drop? A month-by-month table
Our calculator uses a seasonal multiplier for each month, published openly on the methodology page. A “normal” month is 1.00×:
| Month | Multiplier | Month | Multiplier |
|---|---|---|---|
| January | 0.75× | July | 0.98× |
| February | 0.82× | August | 0.98× |
| March | 0.92× | September | 1.02× |
| April | 0.95× | October | 1.10× |
| May | 1.00× | November | 1.25× |
| June | 1.00× | December | 1.35× |
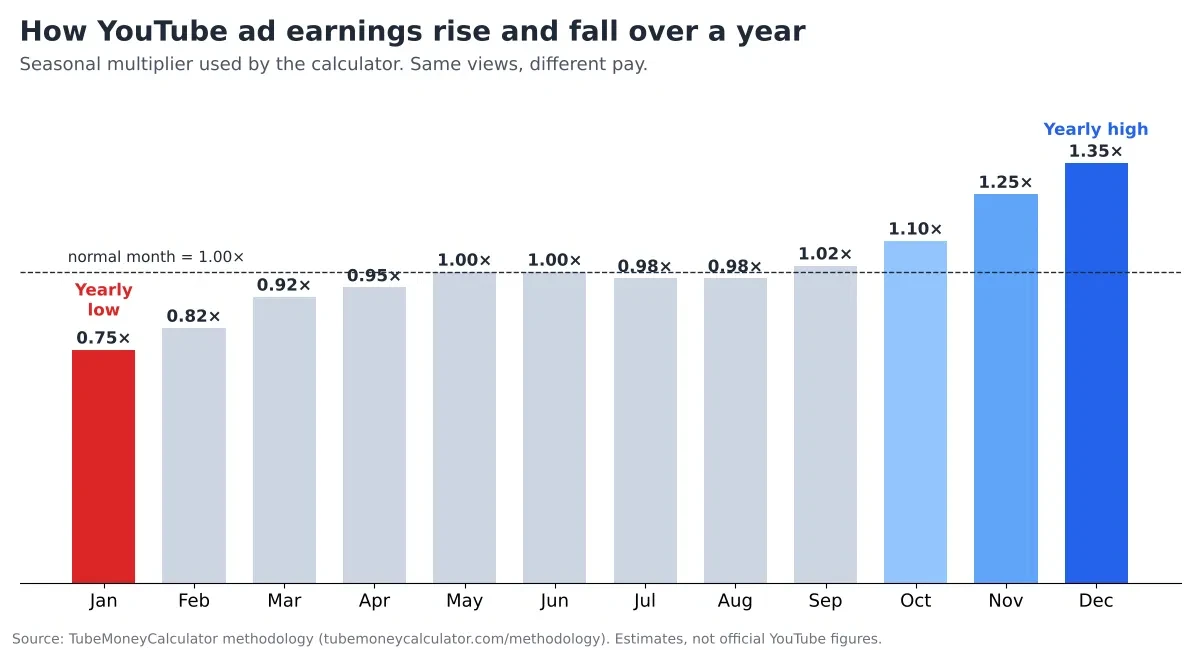
Two things worth knowing about this table. The twelve multipliers add up to 12.12, not 12, so the model is very slightly optimistic across a full year. And these are our planning assumptions, not YouTube figures — YouTube doesn’t publish monthly multipliers. Real swings differ by niche and by year. A finance channel can see a much sharper Q4 spike than a gaming channel.
What the shape tells you: December is the peak, January is the floor, and the climb back takes until roughly May. February is still well down at 0.82×, so one weak month is usually followed by a second.
Worked example 1: a US tech channel, 100,000 views a month
Say your videos are 8 minutes or longer, your audience is mostly in the US, and your niche is technology. From the methodology:
- Low RPM: $8 CPM × 1.00 (US) × 40% monetized views × 55% creator share × 1.5 (mid-roll boost) = $2.64 per 1,000 views
- High RPM: $22 × 1.00 × 60% × 55% × 1.5 = $10.89 per 1,000 views
- A normal month at 100,000 views: $264 to $1,089
Now apply the season, with views held exactly the same:
| Month | Multiplier | Estimated earnings |
|---|---|---|
| December | 1.35× | $356 – $1,470 |
| January | 0.75× | $198 – $817 |
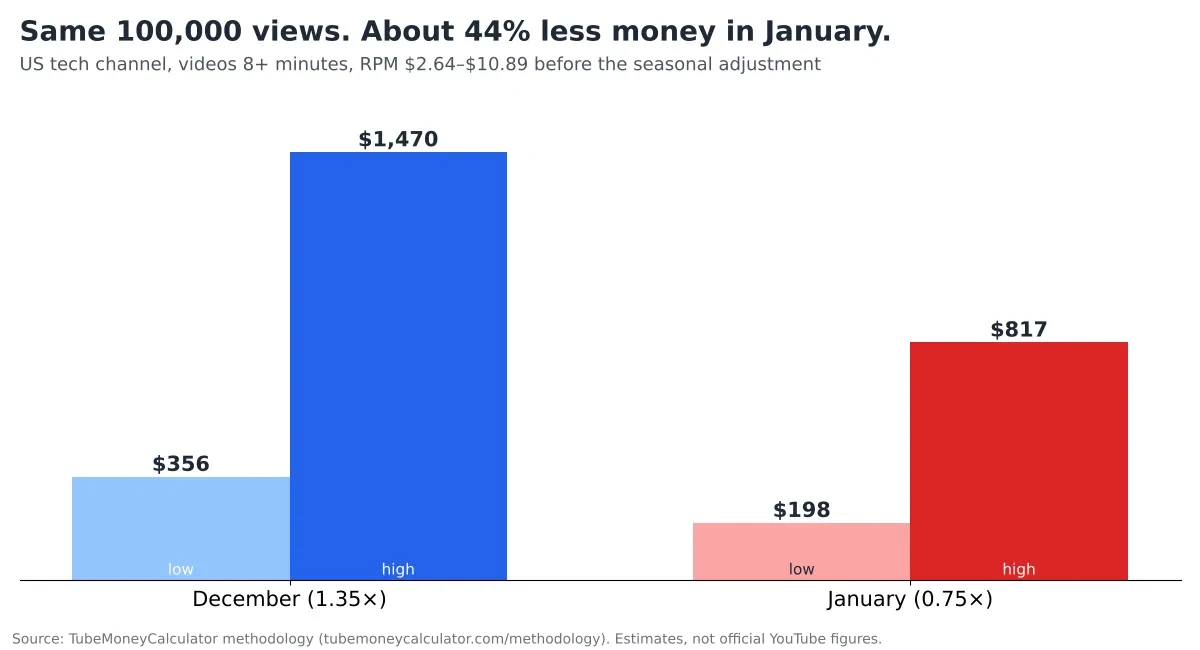
Same channel, same videos, same audience — about 44% less money. To earn in January what you earned in December, you’d need 1.35 ÷ 0.75 = 1.8 times the views. That’s 180,000 instead of 100,000. Which is worth knowing before you set yourself a January target you can’t reach.
Worked example 2: a Canadian gaming channel, 200,000 views a month
Gaming pays less per view than tech, and a Canadian audience is counted at 0.85× the US rate:
- Low RPM: $2 × 0.85 × 40% × 55% × 1.5 = $0.56 per 1,000 views
- High RPM: $8 × 0.85 × 60% × 55% × 1.5 = $3.37 per 1,000 views
- A normal month at 200,000 views: $112 to $673
Across the year, holding views steady:
| Month | Multiplier | Estimated earnings |
|---|---|---|
| December | 1.35× | $151 – $909 |
| January | 0.75× | $84 – $505 |
| Full year | 12.12× total | $1,360 – $8,159 |
(The unrounded RPMs are $0.561 and $3.366, which is why the yearly figures aren’t exactly twelve times a single month.)
The dollar gap looks smaller than the tech channel’s, but the proportion is identical: January is 44% below December in every niche the model covers, because the multiplier is the same. What differs is how much that hurts.
Why it feels even worse: the payout lag
Here’s the part that catches people out. The month you earn money and the month it arrives are not the same.
YouTube finalizes a month’s earnings between the 7th and 12th of the following month, then issues payment between the 21st and 26th if your balance is over the threshold (YouTube Help). A bank transfer can take up to 7 business days on top.
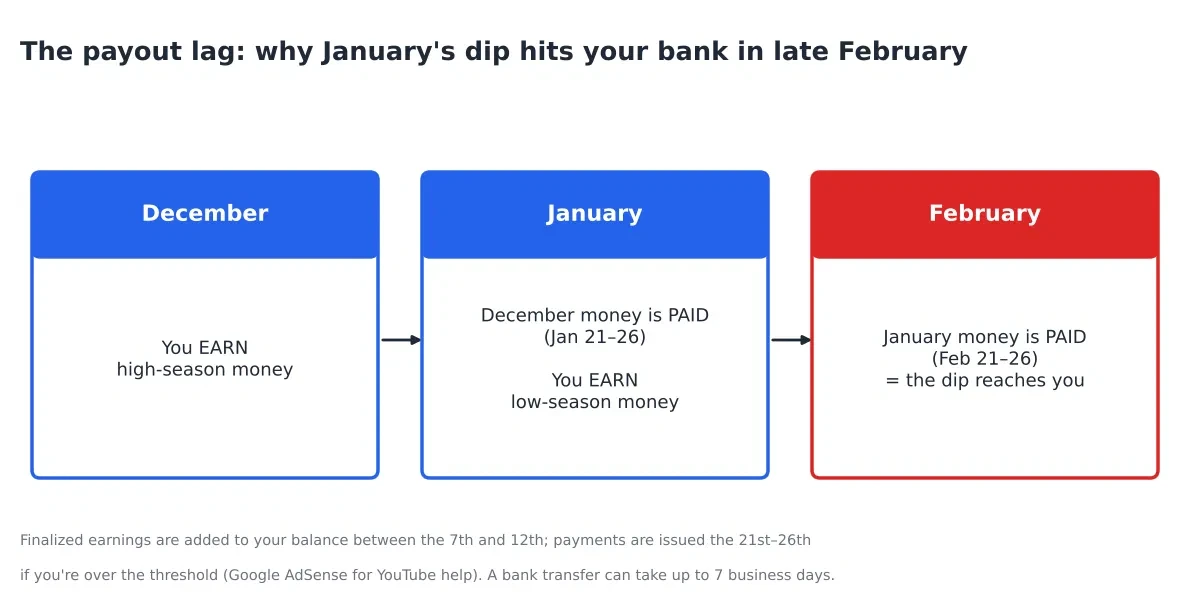
So the sequence goes like this. In December you earn high-season money. In January you get paid that December money — a big, cheerful deposit — while you quietly earn low-season money. Then in late February, the January dip finally lands in your bank account. Your best payday and your worst one are separated by a single month, which makes the fall feel steeper than it is. Our guide to how YouTubers get paid covers the full schedule.
How to check your own seasonal pattern in YouTube Studio
Your channel’s real swing matters more than any model. Here’s how to find it:
- Open YouTube Studio and click Analytics, then the Revenue tab.
- Find the monthly earnings report. YouTube’s revenue report shows your last 6 months broken down by month, which is enough to see a Q4 rise and a January fall.
- Write down RPM for each month, not just total revenue.
- Write down views for each month beside it.
- Compare the two columns. If views stayed flat and RPM fell, that’s the season. If views fell too, you have two separate things happening and should treat them separately.
Do this each January and you’ll build your own multiplier table within two or three years — far more useful than ours, because it’s your niche and your audience.
Is it the season, or something else? A quick checklist
Before blaming January, rule these out:
- Did views actually drop? Holiday traffic patterns change too; people watch differently in January.
- Did your audience country mix shift? A swing toward lower-CPM countries lowers RPM on its own.
- Did more of your views come from Shorts? Shorts pay far less per view than long-form, so a shift in mix moves your blended RPM.
- Any copyright claims or revenue adjustments? YouTube adjusts estimated figures before finalizing them, for things like invalid traffic and claims.
- Did you publish fewer long videos? Fewer 8-minute-plus uploads means fewer mid-roll ads, which the calculator reflects with its 1.5× boost.
How to plan for January (5 steps)
- Budget from your floor month, not your peak. If January is your worst month, run your personal budget on January’s number. Every other month then feels like a surplus instead of a shortfall.
- Set aside part of the Q4 surplus. The extra money in October through December is, in practice, your January and February income arriving early.
- Run both months in the calculator. Tick “Adjust for seasonal CPM” on the earnings estimator, then compare December against January with your real view count so there are no surprises.
- Keep uploading in January. Low RPM doesn’t mean low value. Those views still count toward watch hours, still build your audience, and still earn — just at a lower rate. Stopping costs you momentum at the exact moment your competitors go quiet.
- Time your sponsorship pitches. Brand deals are negotiated directly and aren’t tied to the ad auction, so a sponsor can smooth out a weak ad month.
One more date for 2027 specifically: YouTube’s Partner Program changes take effect February 1, 2027, right in the middle of the low season. If your February 2027 numbers look bad, check the calendar before you blame the new rules — we go through the common mix-ups in 10 myths about YouTube’s 2027 monetization changes.
FAQ
Does RPM recover by itself?
Yes, every year so far. In our model the climb is gradual: 0.82× in February, 0.92× in March, and back to a normal 1.00× around May. There’s no action you need to take for the recovery itself.
Do Shorts earnings drop in January too?
Shorts come from a shared pool rather than per-video ad sales, and YouTube hasn’t published a seasonal pattern for them. Our calculator applies the same monthly setting to Shorts for consistency, but the real swing may be different. Treat Shorts seasonality as unknown rather than assuming it matches long-form.
Is my channel being punished or demonetized?
A seasonal drop affects every channel at once, shows up as a lower RPM on steady views, and reverses by spring. A penalty usually shows differently: limited-ads icons on specific videos, a notice in Studio, or a sudden change on one video rather than across the channel.
Should I stop uploading in January?
No. You’d be giving up views, watch hours and audience growth to avoid a temporary rate dip. If you want to shift effort, move ambitious or expensive projects into the autumn so they earn during the high season, and keep steadier work running through January.
Your next step
Open the YouTube Money Calculator, enter your real monthly views, niche and audience country, and tick Adjust for seasonal CPM. Run it once for December and once for January. Those two numbers are your ceiling and your floor for the year — and knowing both in October beats discovering them in February.
The seasonal multipliers here are our own planning model, published on the methodology page, not official YouTube figures. All earnings are estimates, not promises.